#009: Assembling a custom dashboard for open source maintenance
Over the last two years of maintaining several open source tools of varying complexity and adoption, I’ve learned that beyond a certain scale, keeping release pipelines healthy — ensuring the tools are secure, up-to-date, and ready to ship — becomes increasingly complicated. In practice, this involves the following:
- keeping dependency libraries updated frequently
- ensuring GitHub Actions checks are always passing
- tracking what’s changed on the main branch since the last release
Doing this regularly for multiple tools (~30 at the time of writing) can get tedious. For a while, I’d been trying to improve visibility into these areas using disparate tools. I needed one place to see it all. So, I assembled a dashboard that ties all of this together in one place.
It’s running here: https://gh.dhruvs.space
Operational Visibility at Scale
GitHub’s UI doesn’t lend itself to viewing distilled information for the aforementioned facets in a centralized location. Dependabot pull requests flood the notifications page, drowning out actually useful notifications. Checking scheduled GitHub Actions workflows requires visiting each repository’s Actions tab individually. Viewing unreleased commits means navigating to the latest release and then clicking the “n commits to main since this release” link, which doesn’t even appear for pre-releases. These manual workflows broke down for me once the number of tools reached double digits.
I started by tackling each concern separately, building CLI tools that printed their output to stdout. This worked well, but meant that I could only check the status of my projects when I had access to a terminal. More importantly, these checks were manual; I had to remember to run them. Over time, I realized that a better channel for viewing these reports was the web: HTML reports published on GitHub Pages, updated on a schedule.
As I leveraged these individual reports for maintenance, my approach to maintaining release pipelines crystallized around three questions.
Question #1: What dependency updates were merged recently?
Almost all of my tools make use of third-party libraries, most of which receive regular updates. I prefer to get these updates merged reasonably quickly so as to not build up a backlog. Crucially, these updates sometimes contain critical security patches, and since most of my tools are delivered as binaries that users run on their machines, it’s good form to get these security updates shipped as soon as possible.
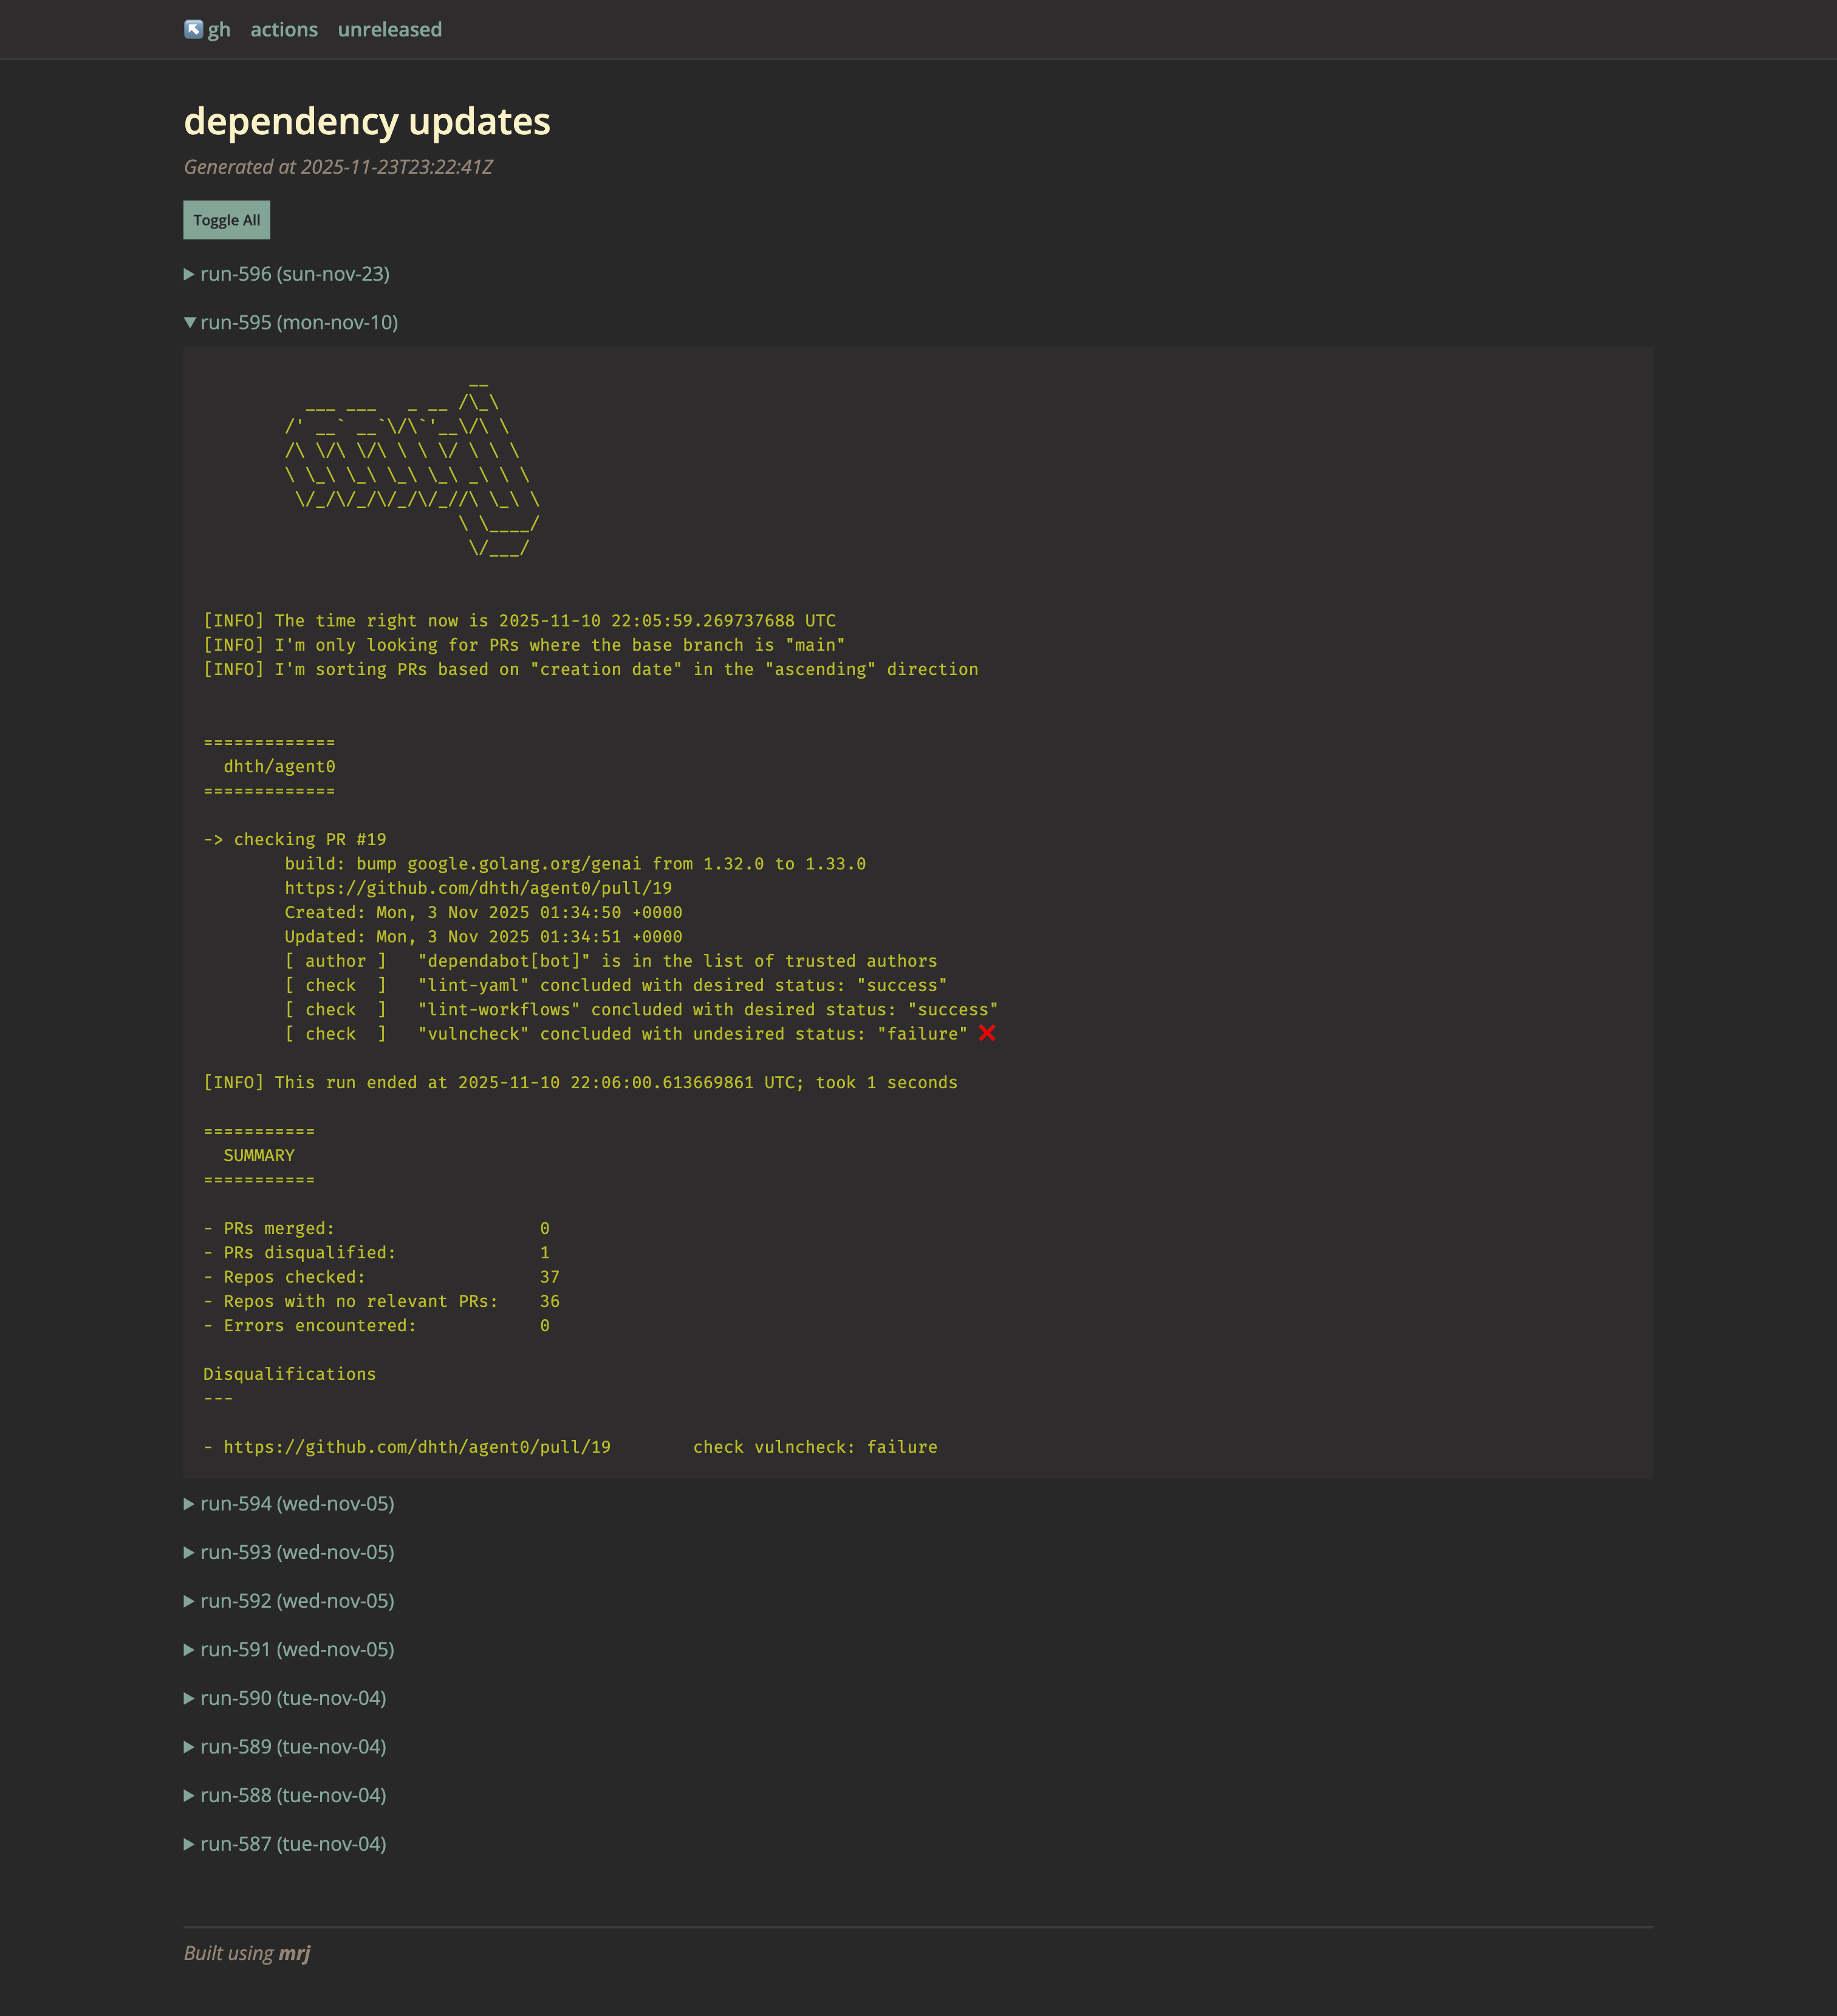
I’ve set up Dependabot to create dependency update pull requests to my repositories once a month. Since these PRs go through automated testing, I set up a mechanism that merges them based on a schedule. Behind the scenes, it’s powered by mrj, a command-line app I wrote a while back.
mrj operates in two phases: execute and report. The execute phase
actually merges open pull requests based on user-defined conditions, while
report generates an HTML report that holds the output of the latest run,
alongside the last few runs. This gives me a historical view of what’s been
merged and when.
Question #2: Are all GitHub Actions checks passing?
Since mrj will merge dependency update PRs by itself, I needed visibility into
whether the GitHub Actions checks on the main branch for each tool are passing
or not. Moreover, I’ve also set up other workflows that run on a schedule —
audit checks, vulnerability scanning checks, virus scanning checks, etc. — which
need to be monitored too. For this, I leverage act3, a command-line tool I
wrote last year.
act3 can operate on the repository corresponding to the directory it’s being run in, or for a globally configured set of repositories. I use the latter for the dashboard. Here it is in action:

In global mode, act3 operates on GitHub Actions workflow IDs, which becomes tedious to find for a large number of repositories. To make this process easier, act3 has a command to generate its own config. Whenever I need to add a new repository to the dashboard, all I need to do is add the new repository to a text file, and then run the following (all of this is scripted in a convenient justfile).
act3 config gen \
	--repos "$(cat repos.txt | xargs | tr ' ' ',')" \
	--workflow-name-filter '^main$' \
	>main.yml
Question #3: What’s been committed since the last release?
Since most of my tools are native binaries, the release process for them involves pre-compiling them for various combinations of architectures and operating systems, uploading them to GitHub Releases, and updating the homebrew formula for each. As such, having a good sense of what commits have landed on the main branch for each tool since the last release is helpful.
For this, I recently wrote unreleased. It generates a report containing the changelog of commits since the last release for each tool. It can output to stdout or generate HTML reports.

Assembling the dashboard
I didn’t envision a centralized dashboard when I wrote act3 or mrj. It was while trying to figure out the changelog for a tool recently that I had the idea of unifying all reports under a common umbrella.
Doing so was straightforward: it only required using a consistent layout and style across all the reports and setting up links between them. What helped was that each tool was inspired by the UNIX philosophy — do one thing well and work together with other tools. As a result, the development of each tool remains isolated: one is written in Go, the other two in Rust. The processes for generating and deploying the reports are also kept separate, as is the frequency with which the reports are produced. This separation also leaves room for other kinds of reports in the future.
A dashboard like this won’t magically take away the operational work needed to maintain healthy release pipelines for ~30 tools, but it’ll lower the friction to do so.